


North America Virtual Power Plant Market Synopsis:
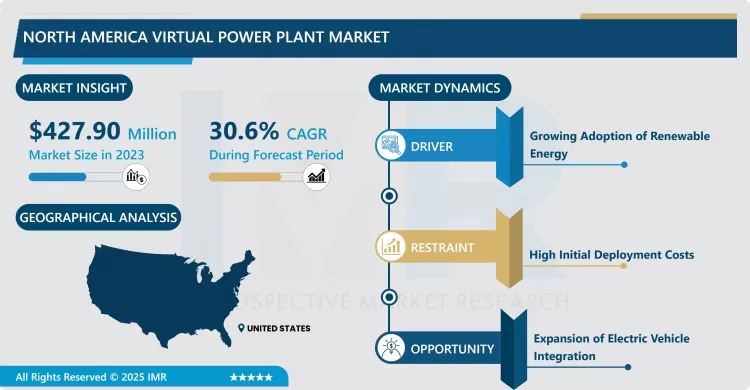
North America Virtual Power Plant Market Size Was Valued at USD 427.90 Million in 2023, and is Projected to Reach USD 4,729.67 Million by 2032, Growing at a CAGR of 30.6% From 2024-2032.
The Virtual Power Plant (VPP) sector in North America encompasses a distributed network of energy resources (DERs), combining adaptable loads, energy storage units, residential solar installations, electric vehicles (EVs), and additional components, which are consolidated and managed to function as a single, virtual energy generator. VPPs employ sophisticated technologies including the Internet of Things (IoT) to harmonize energy distribution and consumption across various assets. VPPs aim to maintain grid reliability, decrease dependence on conventional power generation, and strengthen energy system resilience by allowing distributed resources to adapt instantly to grid demands.
The North American VPP landscape is witnessing substantial growth, driven by broader renewable energy implementation and escalating needs for energy system flexibility. Conventional power facilities incur significant operational and maintenance costs, making VPPs compelling options for grid administrators. Through the combination of energy storage systems, local solar generation, and EV charging infrastructure, VPPs deliver a more sustainable and productive solution. These DERs enable functions such as load reduction, energy price optimization, and consumption management, helping maintain grid equilibrium despite renewable energy output variations.
Recently, the expansion of demand-side flexibility has emerged as a key catalyst for VPP implementation across North America. Initiatives like Demand Response provide incentives for major electricity users to reduce consumption during high-demand periods, helping alleviate grid pressure. For example, EV adoption and intelligent charging platforms enable consumption shifting, helping users avoid premium rates while promoting efficient energy use.
The future outlook for North America's VPP market remains strong, supported by governmental policies and programs promoting clean energy adoption and smart grid development. The objective to triple renewable capacity by 2030, discussed at the G20 Summit, has intensified efforts to develop and deploy VPPs throughout the region.

North America Virtual Power Plant Market Growth and Trend Analysis:
Growing Adoption of Renewable Energy
- The rapid adoption of renewable energy sources like wind and solar in North America is a key driver for the Virtual Power Plant (VPP) market. As these intermittent energy sources become more prevalent, maintaining a balanced energy grid has become increasingly challenging. VPPs offer an effective solution by aggregating and optimizing distributed energy resources (DERs) to ensure grid stability while maximizing the utilization of renewable energy. Government incentives, such as tax credits for renewable installations and policies promoting clean energy transitions, further bolster the growth of VPPs in the region.
High Initial Deployment Costs
- The primary restraints for the VPP market in North America are the high initial cost associated with deploying the necessary infrastructure and technology. Setting up IoT-enabled systems, advanced communication networks, and energy storage solutions requires substantial capital investment. This can be a significant barrier, particularly for small-scale energy providers and businesses, slowing the overall adoption rate of VPP systems despite their long-term benefits.
Expansion of Electric Vehicle Integration
- The growing adoption of electric vehicles (EVs) presents a significant opportunity for the VPP market. Smart EV charging systems enable load shifting, allowing vehicles to charge during off-peak hours and even supply stored energy back to the grid during peak demand periods. This bidirectional energy flow creates new possibilities for grid management while reducing reliance on traditional power plants. With North America seeing a steady rise in EV adoption, this segment is poised to play a crucial role in the growth of VPPs.
North America Virtual Power Plant Market Segment Analysis:
North America Virtual Power Plant Market is segmented based on Technology Type, Source, End Users, and Country
By Technology Type, Demand Response segment is projected to lead the market in 2023
- The Demand Response segment dominates the North American Virtual Power Plant (VPP) market due to its critical role in maintaining grid stability and optimizing energy usage. This technology type focuses on managing electricity demand by incentivizing consumers to reduce or shift their energy usage during peak demand periods.
- Demand Response programs, often driven by utility companies and market operators, reward large energy consumers for curtailing their demand during system peaks, helping to balance the grid and reduce reliance on costly, carbon-intensive power plants. The increasing need for grid flexibility, coupled with advancements in IoT-enabled monitoring systems, has solidified Demand Response as a key component of VPPs.
By Source, The Solar segment led the North American Virtual Power Plant (VPP) market in 2023, commanding a significant 45% market share
- The Solar segment is expected to be the dominant source in the Virtual Power Plant (VPP) market, driven by the widespread adoption of rooftop solar panels and large-scale solar installations. Solar energy is a key component of decentralized energy generation, allowing consumers to reduce their reliance on the grid while contributing excess energy back into the system.
- As the cost of solar technology continues to decline, its integration into VPPs has become more accessible, making it a crucial player in supporting clean energy transitions and grid stability. The scalability and flexibility of solar energy make it an ideal fit for VPPs, especially as demand for renewable energy grows across North America.
North America Virtual Power Plant Market Country Insights:
The United States is projected to lead the Virtual Power Plant (VPP) market over the forecast period
- The United States is poised to dominate the Virtual Power Plant (VPP) market throughout the forecast period, driven by its growing demand for renewable energy integration and grid modernization. The increasing adoption of distributed energy resources (DERs), such as solar, battery storage, and electric vehicles, aligns with the U.S. government's push for cleaner energy solutions.
- As VPPs play a pivotal role in balancing supply and demand in a more sustainable manner, the U.S. market continues to lead with significant investments in smart grid technologies, demand response programs, and energy storage.
Active Players in the North America Virtual Power Plant Market:
- ABB (Switzerland)
- AGL Energy (Australia)
- AutoGrid Systems, Inc. (U.S.)
- BC Hydro (Canada)
- Enel X (U.S.)
- Generac Power Systems Inc. (U.S.)
- General Electric (U.S.)
- Hitachi, Ltd. (Japan)
- Honeywell (U.S.)
- IBM (U.S.)
- Ohm Connect (U.S.)
- Siemens (Germany)
- Tesla (U.S.), and Other Active Players.
Key Industry Developments in the North America Virtual Power Plant Market:
- In November 2024, FranklinWH Energy Storage Inc. and EnergyHub partnered to integrate FranklinWH’s whole-home energy management system with EnergyHub’s Edge DERMS platform, expanding hardware choices for customers and accelerating virtual power plant (VPP) growth across North America by enabling utilities to scale programs, unlock new grid services, and enhance grid reliability.
- In August 2024, Voltus, Inc. joined the RMI-backed Virtual Power Plant Partnership (VP3), leveraging its experience managing nearly 7 GW of distributed energy resources (DERs) across the U.S. and Canada to advance grid resiliency, affordability, and decarbonization by supporting demand-side solutions, developing industry best practices, and shaping policies to enhance the energy transition.
|
North America Virtual Power Plant Market |
|||
|
Base Year: |
2023 |
Forecast Period: |
2024-2032 |
|
Historical Data: |
2017 to 2023 |
Market Size in 2023: |
USD 427.90 Mn. |
|
Forecast Period 2024-32 CAGR: |
30.6% |
Market Size in 2032: |
USD 4,729.67 Mn. |
|
Segments Covered: |
By Technology Type |
|
|
|
By Source |
|
||
|
By End Users |
|
||
|
By Region |
|
||
|
Key Market Drivers: |
|
||
|
Key Market Restraints: |
|
||
|
Key Opportunities: |
|
||
|
Companies Covered in the report: |
|
||
1.1 Scope and Coverage
Chapter 2:Executive Summary
Chapter 3: Market Landscape
3.1 Market Dynamics
3.1.1 Drivers
3.1.2 Restraints
3.1.3 Opportunities
3.1.4 Challenges
3.2 Market Trend Analysis
3.3 PESTLE Analysis
3.4 Porter's Five Forces Analysis
3.5 Industry Value Chain Analysis
3.6 Ecosystem
3.7 Regulatory Landscape
3.8 Price Trend Analysis
3.9 Patent Analysis
3.10 Technology Evolution
3.11 Investment Pockets
3.12 Import-Export Analysis
Chapter 4: North America Virtual Power Plant Market by By Technology Type (2018-2032)
4.1 North America Virtual Power Plant Market Snapshot and Growth Engine
4.2 Market Overview
4.3 Demand Response
4.3.1 Introduction and Market Overview
4.3.2 Historic and Forecasted Market Size in Value USD and Volume Units
4.3.3 Key Market Trends, Growth Factors, and Opportunities
4.3.4 Geographic Segmentation Analysis
4.4 Distributed Generation
4.5 Mixed Asset
Chapter 5: North America Virtual Power Plant Market by By Source (2018-2032)
5.1 North America Virtual Power Plant Market Snapshot and Growth Engine
5.2 Market Overview
5.3 Solar
5.3.1 Introduction and Market Overview
5.3.2 Historic and Forecasted Market Size in Value USD and Volume Units
5.3.3 Key Market Trends, Growth Factors, and Opportunities
5.3.4 Geographic Segmentation Analysis
5.4 Wind
5.5 Small Hydro
5.6 Batteries
5.7 Others
Chapter 6: North America Virtual Power Plant Market by By End Users (2018-2032)
6.1 North America Virtual Power Plant Market Snapshot and Growth Engine
6.2 Market Overview
6.3 Commercial
6.3.1 Introduction and Market Overview
6.3.2 Historic and Forecasted Market Size in Value USD and Volume Units
6.3.3 Key Market Trends, Growth Factors, and Opportunities
6.3.4 Geographic Segmentation Analysis
6.4 Industrial
6.5 Residential
Chapter 7: Company Profiles and Competitive Analysis
7.1 Competitive Landscape
7.1.1 Competitive Benchmarking
7.1.2 North America Virtual Power Plant Market Share by Manufacturer (2024)
7.1.3 Industry BCG Matrix
7.1.4 Heat Map Analysis
7.1.5 Mergers and Acquisitions
7.2 ABB (SWITZERLAND)
7.2.1 Company Overview
7.2.2 Key Executives
7.2.3 Company Snapshot
7.2.4 Operating Business Segments
7.2.5 Product Portfolio
7.2.6 Business Performance
7.2.7 Recent News & Development
7.2.8 SWOT Analysis
7.3 AGL ENERGY (AUSTRALIA)
7.4 AUTOGRID SYSTEMS
7.5 INC. (U.S.)
7.6 BC HYDRO (CANADA)
7.7 ENEL X (U.S.)
7.8 GENERAC POWER SYSTEMS INC. (U.S.)
7.9 GENERAL ELECTRIC (U.S.)
7.10 HITACHI
7.11 LTD. (JAPAN)
7.12 HONEYWELL (U.S.)
7.13 IBM (U.S.)
7.14 OHM CONNECT (U.S.)
7.15 SIEMENS (GERMANY)
7.16 TESLA (U.S.)
7.17 AND
Chapter 8:North America Virtual Power Plant Market Analysis, Insights and Forecast, 2016-2028
8.1 Market Overview
8.2 Key Market Trends, Growth Factors and Opportunities
8.3 Key Players
8.4 Historic and Forecasted Market Size By By Technology Type
8.4.1 Demand Response
8.4.2 Distributed Generation
8.4.3 Mixed Asset
8.5 Historic and Forecasted Market Size By By Source
8.5.1 Solar
8.5.2 Wind
8.5.3 Small Hydro
8.5.4 Batteries
8.5.5 Others
8.6 Historic and Forecasted Market Size By By End Users
8.6.1 Commercial
8.6.2 Industrial
8.6.3 Residential
8.7 Historic and Forecast Market Size by Country
8.7.1 U.S.
8.7.2 Canada
8.7.3 Mexico
Chapter 9 Analyst Viewpoint and Conclusion
9.1 Recommendations and Conclusion
Chapter 10 Our Thematic Research Methodology
10.1 Research Process
10.2 Primary Research
10.3 Secondary Research
|
North America Virtual Power Plant Market |
|||
|
Base Year: |
2023 |
Forecast Period: |
2024-2032 |
|
Historical Data: |
2017 to 2023 |
Market Size in 2023: |
USD 427.90 Mn. |
|
Forecast Period 2024-32 CAGR: |
30.6% |
Market Size in 2032: |
USD 4,729.67 Mn. |
|
Segments Covered: |
By Technology Type |
|
|
|
By Source |
|
||
|
By End Users |
|
||
|
By Region |
|
||
|
Key Market Drivers: |
|
||
|
Key Market Restraints: |
|
||
|
Key Opportunities: |
|
||
|
Companies Covered in the report: |
|
||
Frequently Asked Questions :
The forecast period in the North America Virtual Power Plant Market research report is 2024-2032.
ABB (Switzerland), AGL Energy (Australia), AutoGrid Systems, Inc. (U.S.), BC Hydro (Canada), Enel X (U.S.), Generac Power Systems Inc. (U.S.), General Electric (U.S.), Hitachi, Ltd. (Japan), Honeywell (U.S.), IBM (U.S.), Ohm Connect (U.S.), Siemens (Germany), Tesla (U.S.), and Other Active Players.
The North America Virtual Power Plant Market is segmented into Technology Type, Source, End Users, and Region. By Technology Type, the market is categorized into Demand Response, Distributed Generation, Mixed Asset. By Source, the market is categorized into Solar, Wind, Small Hydro, Batteries, and Others. By End Users, the market is categorized into Commercial, Industrial, Residential. By Region, it is analyzed across North America (U.S.; Canada; Mexico).
The Virtual Power Plant (VPP) sector in North America encompasses a distributed network of energy resources (DERs), combining adaptable loads, energy storage units, residential solar installations, electric vehicles (EVs), and additional components, which are consolidated and managed to function as a single, virtual energy generator. VPPs employ sophisticated technologies including the Internet of Things (IoT) to harmonize energy distribution and consumption across various assets. VPPs aim to maintain grid reliability, decrease dependence on conventional power generation, and strengthen energy system resilience by allowing distributed resources to adapt instantly to grid demands.
North America Virtual Power Plant Market Size Was Valued at USD 427.90 Million in 2023, and is Projected to Reach USD 4,729.67 Million by 2032, Growing at a CAGR of 30.6% From 2024-2032.


