


Process Spectroscopy Market Synopsis:
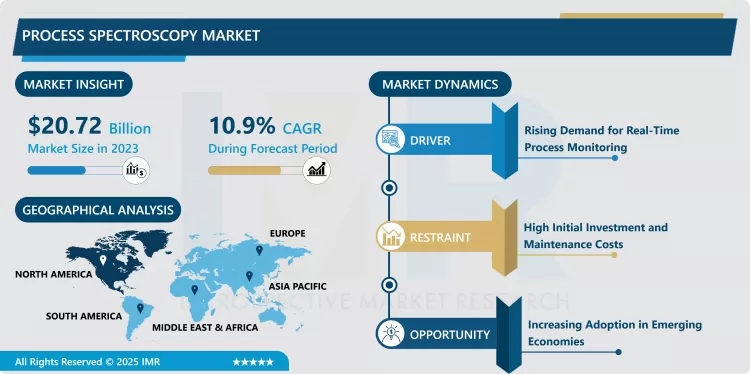
Process Spectroscopy Market Size Was Valued at USD 20.72 Billion in 2023 and is Projected to Reach USD 52.57 Billion by 2032, Growing at a CAGR of 10.9% From 2024-2032.
Process spectroscopy relates to the deployment of IR, NIR, Raman, and atomic spectroscopy throughout industries engaged in manufacturing and processing to provide real-time information. It facilitates industries to calculate, assess, control chemical and physical occurrences by detecting the concentration of material in a solution. The process of spectroscopy brings about production quality, less wastage and more efficiency, and compliance to the law. Present in primary processes of pharmaceuticals and chemical industries and FMCG, F&B and O&G sectors, the growth is driven by innovation in spectroscopy and the integration of automation into industries.
The process spectroscopy market has continued to be a booming market over the past several years due to the ever increasing uses of this technology in all the major sectors of economy for applications such as quality assurance, process efficiency improvements and safety. Traditional process monitoring has become rich with the extra use of automation and artificial intelligence (AI) with spectroscopy for improved visualization of material composition and informed decisions. It is observed that industries like pharmaceutical & chemical sector is now widely relying on spectroscopy mainly due to the regulatory compliance & product quality.
In the same respect, the food & beverage sector has greatly incorporated spectroscopy especially when it comes to quality testing of product, checking for contaminants and overall food quality. Industry 4.0 has given a huge boost to the growth of smart manufacturing solutions, which has also fuelled the growth of the market. Asian Pacific countries are becoming growth significant markets because of the industrialization, government support for high technology manufacturing and rising expenditures in spectroscopic R&D.

Process Spectroscopy Market Trend Analysis:
Integration of AI and Machine Learning in Process Spectroscopy
- One emerging aspect of the process spectroscopy market development is the application of artificial intelligence and machine learning methods to data analysis and process control improvement. AI integrated spectroscopic systems process large complex spectra at a better precision and in real time for predicting failures along with adjustments. Various ML algorithms are being more and more implemented to analyze patterns, forecast composite’s characteristics, and generate usable outputs. Such integration is more revolutionary in fields like pharmaceuticals and petrochemicals sectors as precision and accuracy are the most important factors in these fields. In addition, process spectroscopy executed by artificial intelligence is making industrial processes greener through reduced consumption of resources.
Rising Demand in Emerging Economies
- A more rapid industrialization and developing economy of countries like china, India, Brazil and many other are key factors driving the growth of the process spectroscopy market. These countries are experiencing the rise in the implementation of higher applications of innovative manufacturing technologies within the food and beverages, oil and gas, and pharmaceutical industries. Modernization and automation in the working of various industries are also being supported by the government through its polices and programmes; this are also fuelling the adoption of process spectroscopy. And, most importantly, the trend towards compliance with international standards for quality and safety creates a wealthy market share for spectroscopic solutions. The rising trend in green manufacturing in these areas and the growing awareness of environmental conservation add to the loud for market enhancement.
Process Spectroscopy Market Segment Analysis:
Process Spectroscopy Market is Segmented on the basis of Component, Technology and Application, and Region
By Component, Hardware segment is expected to dominate the market during the forecast period
- Thus, the settings, and the instruments required for them, are expected to constitute the most significant share of the process spectroscopy market for the duration of its given forecast period. Spectrometers and detectors, sources of illumination, and probes are hardware units that are critical in spectroscopic techniques for correct and repeatable analysis. Technological upgrading of utilizing device parts, including portable and miniature spectrometers, are pushing Spectrometry’s adoption across a diverse spectrum of industries. In addition, growing incorporation of hardware with higher sturdiness and accuracy is driving market demand.
- Furthermore, the increasing demand for segmented specialty hardware to meet structural necessities in the industrial segment is driving this segment. Business sectors are buying effector spectroscopy devices to guarantee accuracy and meet set regulatory requirements. Thus, the segment of reliable hardware with the real-time monitoring of the manufacturing process should remain in high demand as industries are to continue their transition to smart manufacturing, thus securing the segment’s leadership.
By Technology, the Atomic Spectroscopy segment held the largest share in 2023
- Out of the process spectroscopy market it is expected that atomic spectroscopy lead the market due to its advantage over applications that require high accuracy and detection of low concentration of specific elements in a matrix. Common in pharmaceuticals and chemicals as well as environmental testing for legal compliance, atomic spectroscopy guarantees right elemental concentration. This makes it a cornerstone technology in the market especially for material testing and quality control as well as a tool for research.
- Additionally, the improvement of atomic spectroscopy, as well as the more advanced and sensitive automated system, has boosted its application. Thanks to the raising interest in sustainability and high requirements to the environmental pollution control the atomic spectroscopy is widely used for identifying dangerous elements in industrial emissions and sewage, strengthening the leadership of the technology.
Process Spectroscopy Market Regional Insights:
North America is Expected to Dominate the Market Over the Forecast period
- Process spectroscopy in 2023 was primarily driven in North America with the region holding the largest share of the global market. The dominance of the region can be explained by the highly developed industrial base and market players’ high interest in innovative solutions. In pharmaceuticals, oil & gas and food & beverages industries, the consumption of spectroscopic solutions is high because of regulatory compliance standards and enhanced process control. Moreover, escalating levels of investment in research and development and policies sponsored by the government encouraging the ecological manufacturing enhances the dominance of North America market.
Active Key Players in the Process Spectroscopy Market:
- ABB Ltd (Switzerland)
- Agilent Technologies Inc. (USA)
- AMETEK Inc. (USA)
- Bruker Corporation (USA)
- Danaher Corporation (USA)
- FOSS A/S (Denmark)
- Horiba Ltd. (Japan)
- JASCO International Co. Ltd. (Japan)
- JEOL Ltd. (Japan)
- Metrohm AG (Switzerland)
- PerkinElmer Inc. (USA)
- Shimadzu Corporation (Japan)
- Thermo Fisher Scientific Inc. (USA)
- Yokogawa Electric Corporation (Japan)
- ZEISS Group (Germany)
- Other Active Players
Key Industry Developments in the Process Spectroscopy Market:
- In March 2024, Applied Spectra, Inc. proudly introduced the J200 CX, a compact and cost-effective LIBS (Laser Induced Breakdown Spectroscopy) instrument. Designed for mobility, its 12” x 12” x 18” footprint and weight under 50 lbs make it ideal for both laboratory and field use. Featuring a high repetition-rate laser, 3D scanning, and a high-sensitivity broadband spectrometer, the J200 CX delivers exceptional analytical performance for solid samples.
- In January 2023, Avantes, a leader in spectroscopy solutions, announced the launch of its new Compact Spectrometer. This versatile device is engineered for diverse applications, from fruit sorting quality control to medical blood analysis. Available in multiple configurations, it boasts exceptional optical characteristics and a high signal-to-noise ratio. The Compact Spectrometer seamlessly integrates with Avantes light sources, accessories, and AvaSoft software, promising outstanding performance across industries.
|
Process Spectroscopy Market |
|||
|
Base Year: |
2023 |
Forecast Period: |
2024-2032 |
|
Historical Data: |
2017 to 2023 |
Market Size in 2023: |
USD 20.72 Billion |
|
Forecast Period 2024-32 CAGR: |
10.9% |
Market Size in 2032: |
USD 52.57 Billion |
|
Segments Covered: |
By Component |
|
|
|
By Technology |
|
||
|
By Application |
|
||
|
By Region |
|
||
|
Key Market Drivers: |
|
||
|
Key Market Restraints: |
|
||
|
Key Opportunities: |
|
||
|
Companies Covered in the report: |
|
||
1.1 Scope and Coverage
Chapter 2:Executive Summary
Chapter 3: Market Landscape
3.1 Market Dynamics
3.1.1 Drivers
3.1.2 Restraints
3.1.3 Opportunities
3.1.4 Challenges
3.2 Market Trend Analysis
3.3 PESTLE Analysis
3.4 Porter's Five Forces Analysis
3.5 Industry Value Chain Analysis
3.6 Ecosystem
3.7 Regulatory Landscape
3.8 Price Trend Analysis
3.9 Patent Analysis
3.10 Technology Evolution
3.11 Investment Pockets
3.12 Import-Export Analysis
Chapter 4: Process Spectroscopy Market by By Component (2018-2032)
4.1 Process Spectroscopy Market Snapshot and Growth Engine
4.2 Market Overview
4.3 Hardware
4.3.1 Introduction and Market Overview
4.3.2 Historic and Forecasted Market Size in Value USD and Volume Units
4.3.3 Key Market Trends, Growth Factors, and Opportunities
4.3.4 Geographic Segmentation Analysis
4.4 Software
Chapter 5: Process Spectroscopy Market by By Technology (2018-2032)
5.1 Process Spectroscopy Market Snapshot and Growth Engine
5.2 Market Overview
5.3 Atomic Spectroscopy
5.3.1 Introduction and Market Overview
5.3.2 Historic and Forecasted Market Size in Value USD and Volume Units
5.3.3 Key Market Trends, Growth Factors, and Opportunities
5.3.4 Geographic Segmentation Analysis
5.4 Mass Spectroscopy
5.5 Molecular Spectroscopy
Chapter 6: Process Spectroscopy Market by By Application (2018-2032)
6.1 Process Spectroscopy Market Snapshot and Growth Engine
6.2 Market Overview
6.3 Polymer
6.3.1 Introduction and Market Overview
6.3.2 Historic and Forecasted Market Size in Value USD and Volume Units
6.3.3 Key Market Trends, Growth Factors, and Opportunities
6.3.4 Geographic Segmentation Analysis
6.4 Pharmaceuticals
6.5 Water & Wastewater Management
6.6 Pulp & Paper
6.7 Oil & Gas
6.8 Metal & Mining
6.9 Chemical
6.10 Food & Agriculture
6.11 Others
Chapter 7: Company Profiles and Competitive Analysis
7.1 Competitive Landscape
7.1.1 Competitive Benchmarking
7.1.2 Process Spectroscopy Market Share by Manufacturer (2024)
7.1.3 Industry BCG Matrix
7.1.4 Heat Map Analysis
7.1.5 Mergers and Acquisitions
7.2 ABB LTD (SWITZERLAND)
7.2.1 Company Overview
7.2.2 Key Executives
7.2.3 Company Snapshot
7.2.4 Role of the Company in the Market
7.2.5 Sustainability and Social Responsibility
7.2.6 Operating Business Segments
7.2.7 Product Portfolio
7.2.8 Business Performance
7.2.9 Key Strategic Moves and Recent Developments
7.2.10 SWOT Analysis
7.3 AGILENT TECHNOLOGIES INC. (USA)
7.4 AMETEK INC. (USA)
7.5 BRUKER CORPORATION (USA)
7.6 DANAHER CORPORATION (USA)
7.7 FOSS A/S (DENMARK)
7.8 HORIBA LTD. (JAPAN)
7.9 JASCO INTERNATIONAL CO. LTD. (JAPAN)
7.10 JEOL LTD. (JAPAN)
7.11 METROHM AG (SWITZERLAND)
7.12 PERKINELMER INC. (USA)
7.13 SHIMADZU CORPORATION (JAPAN)
7.14 THERMO FISHER SCIENTIFIC INC. (USA)
7.15 YOKOGAWA ELECTRIC CORPORATION (JAPAN)
7.16 ZEISS GROUP (GERMANY)
7.17 OTHER ACTIVE PLAYERS
Chapter 8: Global Process Spectroscopy Market By Region
8.1 Overview
8.2. North America Process Spectroscopy Market
8.2.1 Key Market Trends, Growth Factors and Opportunities
8.2.2 Top Key Companies
8.2.3 Historic and Forecasted Market Size by Segments
8.2.4 Historic and Forecasted Market Size By By Component
8.2.4.1 Hardware
8.2.4.2 Software
8.2.5 Historic and Forecasted Market Size By By Technology
8.2.5.1 Atomic Spectroscopy
8.2.5.2 Mass Spectroscopy
8.2.5.3 Molecular Spectroscopy
8.2.6 Historic and Forecasted Market Size By By Application
8.2.6.1 Polymer
8.2.6.2 Pharmaceuticals
8.2.6.3 Water & Wastewater Management
8.2.6.4 Pulp & Paper
8.2.6.5 Oil & Gas
8.2.6.6 Metal & Mining
8.2.6.7 Chemical
8.2.6.8 Food & Agriculture
8.2.6.9 Others
8.2.7 Historic and Forecast Market Size by Country
8.2.7.1 US
8.2.7.2 Canada
8.2.7.3 Mexico
8.3. Eastern Europe Process Spectroscopy Market
8.3.1 Key Market Trends, Growth Factors and Opportunities
8.3.2 Top Key Companies
8.3.3 Historic and Forecasted Market Size by Segments
8.3.4 Historic and Forecasted Market Size By By Component
8.3.4.1 Hardware
8.3.4.2 Software
8.3.5 Historic and Forecasted Market Size By By Technology
8.3.5.1 Atomic Spectroscopy
8.3.5.2 Mass Spectroscopy
8.3.5.3 Molecular Spectroscopy
8.3.6 Historic and Forecasted Market Size By By Application
8.3.6.1 Polymer
8.3.6.2 Pharmaceuticals
8.3.6.3 Water & Wastewater Management
8.3.6.4 Pulp & Paper
8.3.6.5 Oil & Gas
8.3.6.6 Metal & Mining
8.3.6.7 Chemical
8.3.6.8 Food & Agriculture
8.3.6.9 Others
8.3.7 Historic and Forecast Market Size by Country
8.3.7.1 Russia
8.3.7.2 Bulgaria
8.3.7.3 The Czech Republic
8.3.7.4 Hungary
8.3.7.5 Poland
8.3.7.6 Romania
8.3.7.7 Rest of Eastern Europe
8.4. Western Europe Process Spectroscopy Market
8.4.1 Key Market Trends, Growth Factors and Opportunities
8.4.2 Top Key Companies
8.4.3 Historic and Forecasted Market Size by Segments
8.4.4 Historic and Forecasted Market Size By By Component
8.4.4.1 Hardware
8.4.4.2 Software
8.4.5 Historic and Forecasted Market Size By By Technology
8.4.5.1 Atomic Spectroscopy
8.4.5.2 Mass Spectroscopy
8.4.5.3 Molecular Spectroscopy
8.4.6 Historic and Forecasted Market Size By By Application
8.4.6.1 Polymer
8.4.6.2 Pharmaceuticals
8.4.6.3 Water & Wastewater Management
8.4.6.4 Pulp & Paper
8.4.6.5 Oil & Gas
8.4.6.6 Metal & Mining
8.4.6.7 Chemical
8.4.6.8 Food & Agriculture
8.4.6.9 Others
8.4.7 Historic and Forecast Market Size by Country
8.4.7.1 Germany
8.4.7.2 UK
8.4.7.3 France
8.4.7.4 The Netherlands
8.4.7.5 Italy
8.4.7.6 Spain
8.4.7.7 Rest of Western Europe
8.5. Asia Pacific Process Spectroscopy Market
8.5.1 Key Market Trends, Growth Factors and Opportunities
8.5.2 Top Key Companies
8.5.3 Historic and Forecasted Market Size by Segments
8.5.4 Historic and Forecasted Market Size By By Component
8.5.4.1 Hardware
8.5.4.2 Software
8.5.5 Historic and Forecasted Market Size By By Technology
8.5.5.1 Atomic Spectroscopy
8.5.5.2 Mass Spectroscopy
8.5.5.3 Molecular Spectroscopy
8.5.6 Historic and Forecasted Market Size By By Application
8.5.6.1 Polymer
8.5.6.2 Pharmaceuticals
8.5.6.3 Water & Wastewater Management
8.5.6.4 Pulp & Paper
8.5.6.5 Oil & Gas
8.5.6.6 Metal & Mining
8.5.6.7 Chemical
8.5.6.8 Food & Agriculture
8.5.6.9 Others
8.5.7 Historic and Forecast Market Size by Country
8.5.7.1 China
8.5.7.2 India
8.5.7.3 Japan
8.5.7.4 South Korea
8.5.7.5 Malaysia
8.5.7.6 Thailand
8.5.7.7 Vietnam
8.5.7.8 The Philippines
8.5.7.9 Australia
8.5.7.10 New Zealand
8.5.7.11 Rest of APAC
8.6. Middle East & Africa Process Spectroscopy Market
8.6.1 Key Market Trends, Growth Factors and Opportunities
8.6.2 Top Key Companies
8.6.3 Historic and Forecasted Market Size by Segments
8.6.4 Historic and Forecasted Market Size By By Component
8.6.4.1 Hardware
8.6.4.2 Software
8.6.5 Historic and Forecasted Market Size By By Technology
8.6.5.1 Atomic Spectroscopy
8.6.5.2 Mass Spectroscopy
8.6.5.3 Molecular Spectroscopy
8.6.6 Historic and Forecasted Market Size By By Application
8.6.6.1 Polymer
8.6.6.2 Pharmaceuticals
8.6.6.3 Water & Wastewater Management
8.6.6.4 Pulp & Paper
8.6.6.5 Oil & Gas
8.6.6.6 Metal & Mining
8.6.6.7 Chemical
8.6.6.8 Food & Agriculture
8.6.6.9 Others
8.6.7 Historic and Forecast Market Size by Country
8.6.7.1 Turkiye
8.6.7.2 Bahrain
8.6.7.3 Kuwait
8.6.7.4 Saudi Arabia
8.6.7.5 Qatar
8.6.7.6 UAE
8.6.7.7 Israel
8.6.7.8 South Africa
8.7. South America Process Spectroscopy Market
8.7.1 Key Market Trends, Growth Factors and Opportunities
8.7.2 Top Key Companies
8.7.3 Historic and Forecasted Market Size by Segments
8.7.4 Historic and Forecasted Market Size By By Component
8.7.4.1 Hardware
8.7.4.2 Software
8.7.5 Historic and Forecasted Market Size By By Technology
8.7.5.1 Atomic Spectroscopy
8.7.5.2 Mass Spectroscopy
8.7.5.3 Molecular Spectroscopy
8.7.6 Historic and Forecasted Market Size By By Application
8.7.6.1 Polymer
8.7.6.2 Pharmaceuticals
8.7.6.3 Water & Wastewater Management
8.7.6.4 Pulp & Paper
8.7.6.5 Oil & Gas
8.7.6.6 Metal & Mining
8.7.6.7 Chemical
8.7.6.8 Food & Agriculture
8.7.6.9 Others
8.7.7 Historic and Forecast Market Size by Country
8.7.7.1 Brazil
8.7.7.2 Argentina
8.7.7.3 Rest of SA
Chapter 9 Analyst Viewpoint and Conclusion
9.1 Recommendations and Concluding Analysis
9.2 Potential Market Strategies
Chapter 10 Research Methodology
10.1 Research Process
10.2 Primary Research
10.3 Secondary Research
|
Process Spectroscopy Market |
|||
|
Base Year: |
2023 |
Forecast Period: |
2024-2032 |
|
Historical Data: |
2017 to 2023 |
Market Size in 2023: |
USD 20.72 Billion |
|
Forecast Period 2024-32 CAGR: |
10.9% |
Market Size in 2032: |
USD 52.57 Billion |
|
Segments Covered: |
By Component |
|
|
|
By Technology |
|
||
|
By Application |
|
||
|
By Region |
|
||
|
Key Market Drivers: |
|
||
|
Key Market Restraints: |
|
||
|
Key Opportunities: |
|
||
|
Companies Covered in the report: |
|
||
Frequently Asked Questions :
The forecast period in the Process Spectroscopy Market research report is 2024-2032.
ABB Ltd (Switzerland), Agilent Technologies Inc. (USA), AMETEK Inc. (USA), Bruker Corporation (USA), Danaher Corporation (USA), FOSS A/S (Denmark), Horiba Ltd. (Japan), JASCO International Co. Ltd. (Japan), JEOL Ltd. (Japan), Metrohm AG (Switzerland), PerkinElmer Inc. (USA), Shimadzu Corporation (Japan), Thermo Fisher Scientific Inc. (USA), Yokogawa Electric Corporation (Japan), ZEISS Group (Germany), Other Active Players.
The Process Spectroscopy Market is segmented into Component, Technology, Application and region. By Component, the market is categorized into Hardware, Software. By Technology, the market is categorized into Atomic Spectroscopy, Mass Spectroscopy, Molecular Spectroscopy. By Application, the market is categorized into Polymer, Pharmaceuticals, Water & Wastewater Management, Pulp & Paper, Oil & Gas, Metal & Mining, Chemical, Food & Agriculture, Others. By region, it is analyzed across North America (U.S., Canada, Mexico), Eastern Europe (Russia, Bulgaria, The Czech Republic, Hungary, Poland, Romania, Rest of Eastern Europe), Western Europe (Germany, UK, France, The Netherlands, Italy, Spain, Rest of Western Europe), Asia Pacific (China, India, Japan, South Korea, Malaysia, Thailand, Vietnam, The Philippines, Australia, New-Zealand, Rest of APAC), Middle East & Africa (Turkiye, Bahrain, Kuwait, Saudi Arabia, Qatar, UAE, Israel, South Africa), South America (Brazil, Argentina, Rest of SA).
Process spectroscopy relates to the deployment of IR, NIR, Raman, and atomic spectroscopy throughout industries engaged in manufacturing and processing to provide real-time information. It facilitates industries to calculate, assess, control chemical and physical occurrence by detecting concentration of material in a solution. The process of spectroscopy brings about production quality, less wastage and more efficiency, and compliance to the law. Present in primary processes of pharmaceuticals and chemical industries and FMCG, F&B and O&G sectors, the growth is driven by innovation in spectroscopy and the integration of automation into industries.
Process Spectroscopy Market Size Was Valued at USD 20.72 Billion in 2023, and is Projected to Reach USD 52.57 Billion by 2032, Growing at a CAGR of 10.9% From 2024-2032.


